Class of Service
Portworx provides the ability to specify a class of service for IOPS, throughput and more at the container granularity. Through class of service (also known as a CoS), a single volume’s class of service can be controlled and mapped to specific underlying storage infrastructure capabilities.
Explanation of Class of Service
Applications have different storage performance requirements; some require higher IOPS/throughput performance characteristics than others. Portworx provides the ability to specify a class of service level at the container granularity. Containers operating at different classes of service can co-exist in the same node/cluster. Using class of service you can tune your volume for higher throughput and/or IOPS. The _High_CoS is optimized for IOPS, Medium is optimized for throughput.
Usage
To create a volume with a specific class of service level, use the --io_prioirity parameter in the volume create options. As with other parameters, this CoS parameter can also be passed in as a label via Docker or any scheduler.
pxctl volume create --io_priority high volume-nameHere is an example output from fio when measuring the CoS feature on an Intel server with NVMe and SATA drives.
| Random | Low CoS IOPS | High CoS IOPS |
|---|---|---|
| 4K | 768 | 65024 |
| 8K | 642 | 46848 |
| 64K | 496 | 9824 |
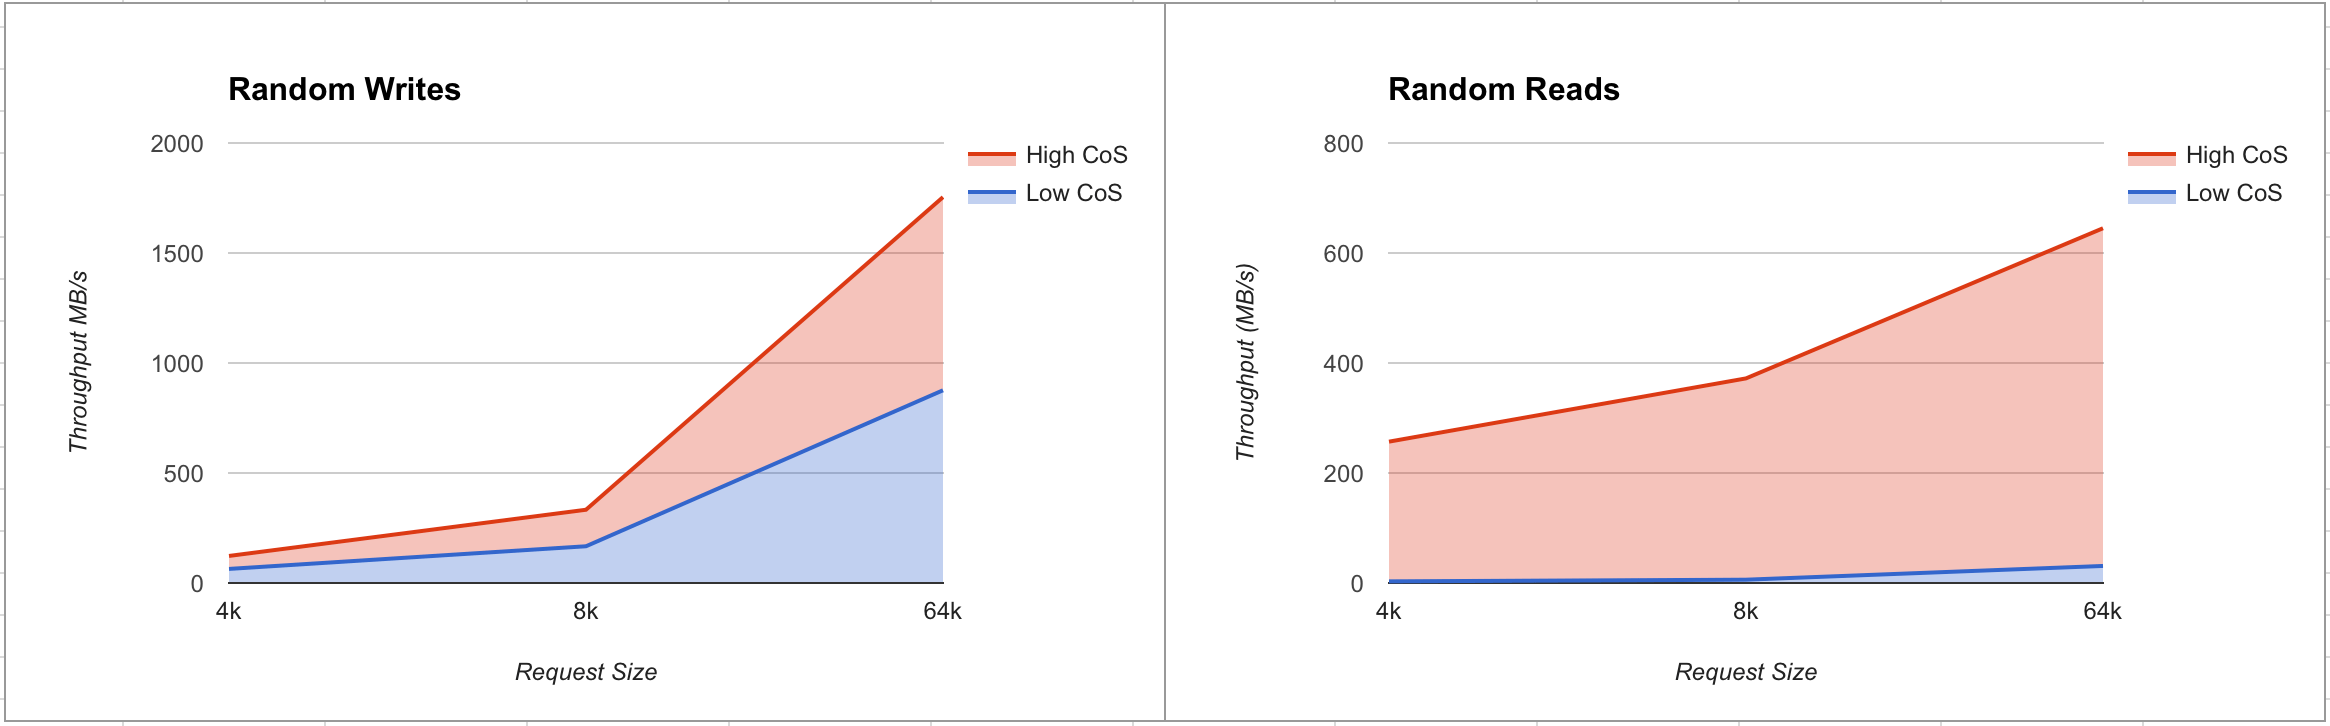
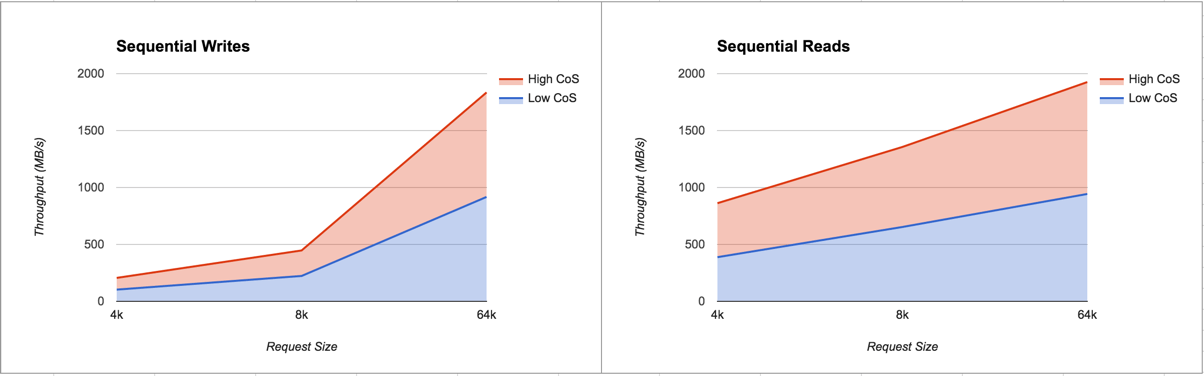
The graph below shows the sequential and random read and write performance on high and low CoS volume types:
Random Read and Writes
Sequential Read and Writes
Try it out on Amazon
Create EBS volumes AWS
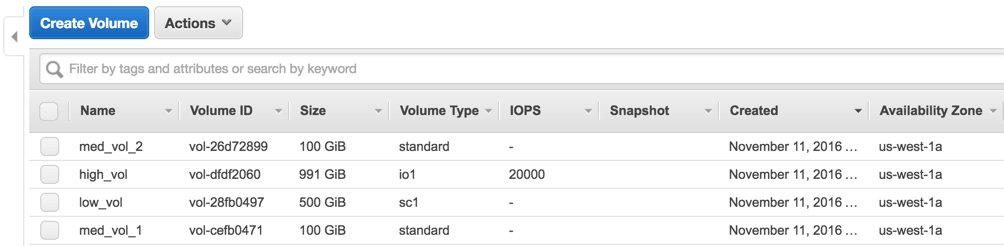
Here, we create volumes of 3 different volume types in AWS. Refer to AWS EBS volume types for more information on the EBS volume capabilities. Portworx automatically detect the volume type and classify it into the correct service category.
- Create one 500GB HDD volume
- Create one 100GB standard volume
- Create one 1000GB IO optimized volume
Here is what you should see when you list your block devices:
lsblkNAME MAJ:MIN RM SIZE RO TYPE MOUNTPOINT
xvda 202:0 0 64G 0 disk
└─xvda1 202:1 0 64G 0 part /
xvdj 202:144 0 128G 0 disk
xvdl 202:176 0 500G 0 disk
xvdn 202:208 0 999G 0 diskCreate a config.json with the following drives in it… we will add the fourth standard ebs volume later
cat /etc/pwx/config.json{
"alertingurl": "",
"clusterid": "cos-demo-cluster",
"dataiface": "",
"kvdb": [
"etcd://localhost:4001"
],
"mgtiface": "",
"storage": {
"devices": [
"/dev/xvdl",
"/dev/xvdn",
"/dev/xvdj"
]
}
}pxctl statusStatus: PX is operational
Node ID: 5f794df0-b337-42d7-afc0-440c19fc4b0e
IP: 172.31.2.134
Local Storage Pool: 3 pools
Pool Cos Size Used Status Zone Region
0 COS_TYPE_LOW 500 GiB 1.1 GiB Online a us-west-1
1 COS_TYPE_HIGH 999 GiB 1.1 GiB Online a us-west-1
2 COS_TYPE_MEDIUM 128 GiB 1.1 GiB Online a us-west-1
Local Storage Devices: 3 devices
Device Path Media Type Size Last-Scan
0:1 /dev/xvdl STORAGE_MEDIUM_SSD 500 GiB 14 Nov 16 02:01 UTC
1:1 /dev/xvdn STORAGE_MEDIUM_SSD 991 GiB 14 Nov 16 02:01 UTC
2:1 /dev/xvdj STORAGE_MEDIUM_SSD 128 GiB 14 Nov 16 02:01 UTC
total - 1.6 TiB
Cluster Summary
Cluster ID: ohyeah0014
Node IP: 172.31.2.134 - Capacity: 3.2 GiB/1.6 TiB Online (This node)
Global Storage Pool
Total Used : 3.2 GiB
Total Capacity : 1.6 TiBThe status command on any node shows the pools with different classes of services listed. The format x:yin the Device column indicates the pool:device participating in that pool.
Inspect different pools
pxctl service drive showPX drive configuration:
Pool ID: 0
Cos: COS_TYPE_LOW
Size: 500 GiB
Status: Online
Has meta data: No
Drives:
1: /dev/xvdl, 4.1 GiB allocated of 500 GiB, Online
Pool ID: 1
Cos: COS_TYPE_HIGH
Size: 991 GiB
Status: Online
Has meta data: No
Drives:
1: /dev/xvdn, 2.1 GiB allocated of 991 GiB, Online
Pool ID: 2
Cos: COS_TYPE_MEDIUM
Size: 128 GiB
Status: Online
Has meta data: Yes
Drives:
1: /dev/xvdj, 2.1 GiB allocated of 128 GiB, OnlineMeasure Performance
Let’s first create three volumes with a high, medium and low class of service:
pxctl volume create --io_priority high test-high --size 8
test-high

pxctl volume create --io_priority med test-med --size 8
test-med

pxctl volume create --io_priority low test-low --size 8
test-low
Now we use fio to measure Portworx volume performance on each of these volumes. Note that backend disk performance while performance tests are running can be visualized with iostat
iostat -xm 1Device: rrqm/s wrqm/s r/s w/s rMB/s wMB/s avgrq-sz avgqu-sz await r_await w_await svctm %util
xvdj 30.00 114.00 660.00 380.00 10.61 43.66 106.87 48.63 93.53 1.30 253.71 0.67 70.00
xvdl 0.00 0.00 0.00 0.00 0.00 0.00 0.00 0.00 0.00 0.00 0.00 0.00 0.00
xvdn 0.00 0.00 0.00 0.00 0.00 0.00 0.00 0.00 0.00 0.00 0.00 0.00 0.00Test a high CoS volume on EBS
docker run --rm --volume-driver=pxd -v test-high:/test          \
	gourao/fio /usr/bin/fio --blocksize=16k -directory=/test      \
	--filename=test --ioengine=libaio --readwrite=randrw          \
	--size=1G --name=test --verify=meta --do_verify=1             \
	--verify_pattern=0xDeadBeef --direct=1 --gtod_reduce=1        \
	--iodepth=128 --randrepeat=1  --end_fsync=1
test: (g=0): rw=randread, bs=4K-4K/4K-4K/4K-4K, ioengine=libaio, iodepth=128
fio-2.1.11
Starting 1 process
test: (groupid=0, jobs=1): err= 0: pid=6: Tue Nov 15 07:49:40 2016
read : io=4096.0MB, bw=41384KB/s, iops=10346, runt=101350msec
cpu : usr=4.06%, sys=15.86%, ctx=462899, majf=0, minf=134
IO depths : 1=0.1%, 2=0.1%, 4=0.1%, 8=0.1%, 16=0.1%, 32=0.1%, >=64=100.0%
submit : 0=0.0%, 4=100.0%, 8=0.0%, 16=0.0%, 32=0.0%, 64=0.0%, >=64=0.0%
complete : 0=0.0%, 4=100.0%, 8=0.0%, 16=0.0%, 32=0.0%, 64=0.0%, >=64=0.1%
issued : total=r=1048576/w=0/d=0, short=r=0/w=0/d=0
latency : target=0, window=0, percentile=100.00%, depth=128
Run status group 0 (all jobs):
READ: io=4096.0MB, aggrb=41384KB/s, minb=41384KB/s, maxb=41384KB/s, mint=101350msec, maxt=101350msec
Disk stats (read/write):
pxd!pxd110428589532375940: ios=1043909/5, merge=0/2, ticks=12308307/116, in_queue=12310012, util=100.00%Test a medium CoS volume on EBS
docker run --rm --volume-driver=pxd -v test-med:/test            \
	gourao/fio /usr/bin/fio --blocksize=16k -directory=/test       \
	--filename=test --ioengine=libaio --readwrite=randrw           \
	--size=4G --name=test --direct=1 --gtod_reduce=1               \
	--iodepth=128 --randrepeat=1  --end_fsync=1
test: (g=0): rw=randread, bs=4K-4K/4K-4K/4K-4K, ioengine=libaio, iodepth=128
fio-2.1.11
Starting 1 process
test: (groupid=0, jobs=1): err= 0: pid=7: Tue Nov 15 08:00:47 2016
read : io=4096.0MB, bw=23135KB/s, iops=5783, runt=181295msec
cpu : usr=2.74%, sys=10.46%, ctx=591148, majf=0, minf=134
IO depths : 1=0.1%, 2=0.1%, 4=0.1%, 8=0.1%, 16=0.1%, 32=0.1%, >=64=100.0%
submit : 0=0.0%, 4=100.0%, 8=0.0%, 16=0.0%, 32=0.0%, 64=0.0%, >=64=0.0%
complete : 0=0.0%, 4=100.0%, 8=0.0%, 16=0.0%, 32=0.0%, 64=0.0%, >=64=0.1%
issued : total=r=1048576/w=0/d=0, short=r=0/w=0/d=0
latency : target=0, window=0, percentile=100.00%, depth=128
Run status group 0 (all jobs):
READ: io=4096.0MB, aggrb=23135KB/s, minb=23135KB/s, maxb=23135KB/s, mint=181295msec, maxt=181295msec
Disk stats (read/write):
pxd!pxd230469319006318075: ios=1045946/4, merge=0/1, ticks=22656364/162, in_queue=22658103, util=100.00%Test a low CoS volume on EBS
docker run --rm --volume-driver=pxd -v test-low:/test           \
	gourao/fio /usr/bin/fio --blocksize=4k -directory=/test       \
	--filename=test --ioengine=libaio --readwrite=randrw          \
	--size=1G --name=test --direct=1 --gtod_reduce=1              \
	--iodepth=128 --randrepeat=1  --end_fsync=1
test: (g=0): rw=randread, bs=4K-4K/4K-4K/4K-4K, ioengine=libaio, iodepth=128
fio-2.1.11
Starting 1 process
test: (groupid=0, jobs=1): err= 0: pid=6: Tue Nov 15 09:20:17 2016
read : io=1024.0MB, bw=365111B/s, iops=89, runt=2940858msec
cpu : usr=0.05%, sys=0.19%, ctx=160992, majf=0, minf=134
IO depths : 1=0.1%, 2=0.1%, 4=0.1%, 8=0.1%, 16=0.1%, 32=0.1%, >=64=100.0%
submit : 0=0.0%, 4=100.0%, 8=0.0%, 16=0.0%, 32=0.0%, 64=0.0%, >=64=0.0%
complete : 0=0.0%, 4=100.0%, 8=0.0%, 16=0.0%, 32=0.0%, 64=0.0%, >=64=0.1%
issued : total=r=262144/w=0/d=0, short=r=0/w=0/d=0
latency : target=0, window=0, percentile=100.00%, depth=128
Run status group 0 (all jobs):
READ: io=1024.0MB, aggrb=356KB/s, minb=356KB/s, maxb=356KB/s, mint=2940858msec, maxt=2940858msec
Disk stats (read/write):
pxd!pxd660995725854051776: ios=260024/5, merge=0/2, ticks=376295185/22319, in_queue=376318258, util=100.00%Summary of AWS Results (4K Random Reads)
| CoS | Avg IOPS | Avg Response Time |
|---|---|---|
| High | 10346 | 0.58ms |
| Medium | 5783 | 0.54ms |
| Low | 89 | 23.61ms |